
Process Capability Index
Trevor Hendricks2024-06-11T21:12:30+00:00Consistent quality and repeatability are integral to cable manufacturing, and each influences all that we do at iRex. These factors inform the machines we buy, the teams we assemble, and the processes we put in place to measure our outputs. One measure is a Process Capability Index, which we detail below.
What is a Process Capability Index?
The process capability index is a subset of statistical process control (SPC), which is quality control through the use of statistics. Process capability can be further broken down into two values: Cp and Cpk. The purpose of Process Capability (Cp) is to measure how much an output – such as cable length or crimp height – varies, and whether those outputs stay within an acceptable tolerance range as defined by an upper and lower limit. The Process Capability Index (Cpk) measures how closely the range of those values is centered between the two limits.
To use an analogy, think of the upper and lower limits representing goal posts at a football game. Process capability is concerned with how much the distance varies between successful field goal attempts, and the index is concerned with how closely the spread of attempts line up with the center of the uprights.
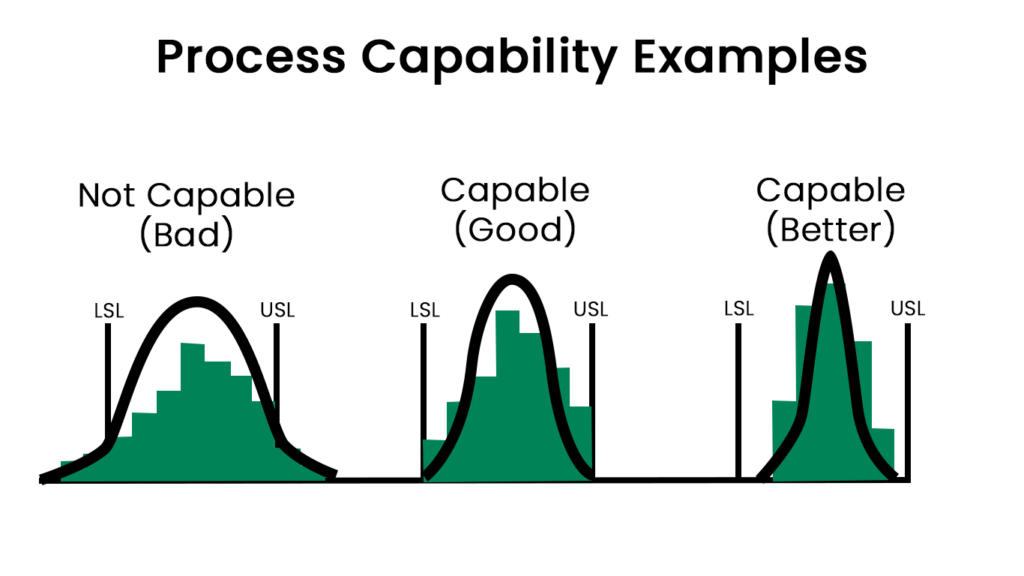
Cp is calculated as taking a sample of articles over a period of time and plotting their values in a histogram. It’s important that these samples are randomly taken from various times of manufacture, rather than just the first articles made, to account for machine drift. Once the outputs are plotted on the graph, the values are inspected to see if they fit between the upper and lower bounds set by a client’s tolerance (e.g. a +/- 0.4 inch tolerance for a cable length). If the values are distributed evenly and can be represented by a bell curve within the upper and lower bounds, the process is said to be capable. The actual value is determined by the estimated variance across the outputs. This spread is processed using Six Sigma, and correlates to the standard deviations from the target output. A higher Cp denotes a narrower bell curve and a better, more controlled process.

What Process Capability Index Is Not
Determining process capability is meant to be a snapshot in time, not representative of a manufacturing process into perpetuity. As such, Cp and Cpk are values that should be used to verify that equipment is running correctly and should be re-measured periodically as part of an ongoing SPC regimen.
Evaluating process capability should only be done on established, stable processes. If special circumstances cause variations, Cp is not equipped to account for them without a sufficiently large sample size. New, untested processes can also be tested, but through a different process called the Preliminary Process Capability Index (Ppk), which is based off the study of a body of complete work rather than a sample of ongoing work like Cpk.
It should be noted that process capability is not a useful index for processes involving a large amount of human interaction, or open to human error, such as labeling. The purpose of calculating Cp is to make incremental improvements and, with the help of additional run and control charts, determine when machines drift from their intended target output.
How iRex uses Process Capability Indices
At iRex we typically check the process capability of our machines for all our high-volume clients as part of our normal statistical process controls. While we can perform this for any client, high volume clients provide us with the most useful sample sizes and typically have workflows that are more uniform and routine.
To use cable length as an example, we typically take a sample size of 25-50 cables for different lengths and tolerances over the course of the day. As stated before, these are randomly sampled over a period of time and not consecutively produced. These lengths are then recorded and plotted in a graph to first confirm that all samples fall within tolerance. After that is determined, the results are run through statistical analysis to determine if the Cpk falls within the manufacturer’s specifications. If the results are out of specification, we respond with a number of maintenance protocols. Luckily, with our Schleuniger machines, this is rarely an issue given their exceptional quality and tolerances.
As stated before, measuring process capability is merely one tool in our quality assurance toolbox. After a Cpk is calculated and confirmed to be capable, we continue to monitor production using other statistical process controls, like control and run charts, as well as performing daily cleanings and monthly inspections of our machines. To learn more about our processes and how they can benefit your project, contact us today.