Understanding Pull Tests for Cables and Crimps
Trevor Hendricks2024-06-11T21:12:52+00:00If you’ve been following our series on cable crimps and the need to pull test them, then you’ll be left with the inevitable question – what to do with the results of a cable pull test. We’ll unpack that issue in this article.
Background on Tensile Testing
First, it’s helpful to detail exactly what is happening in a pull test, and to define some base terms that apply to tensile testing of all materials – not just cables. When a cable is subjected to a pull test, one end is fixed at the bottom while the other end is attached to a movement force, typically along a linear axis. Force is applied to varying degrees – depending on whether the test method calls for Pull and Break, Pull and Hold, or Pull and Return Test. iRex conducts Pull and Break, unless otherwise instructed, in which force is applied until the terminal separates from the wire or the wire itself breaks. This article will focus on the results of that method of test.
Pull and Break testing is a destructive testing technique that can be conducted upon request. At iRex, we perform these tests with the help of Austin Reliability Labs, a fellow member of the TyRex Technology Family.
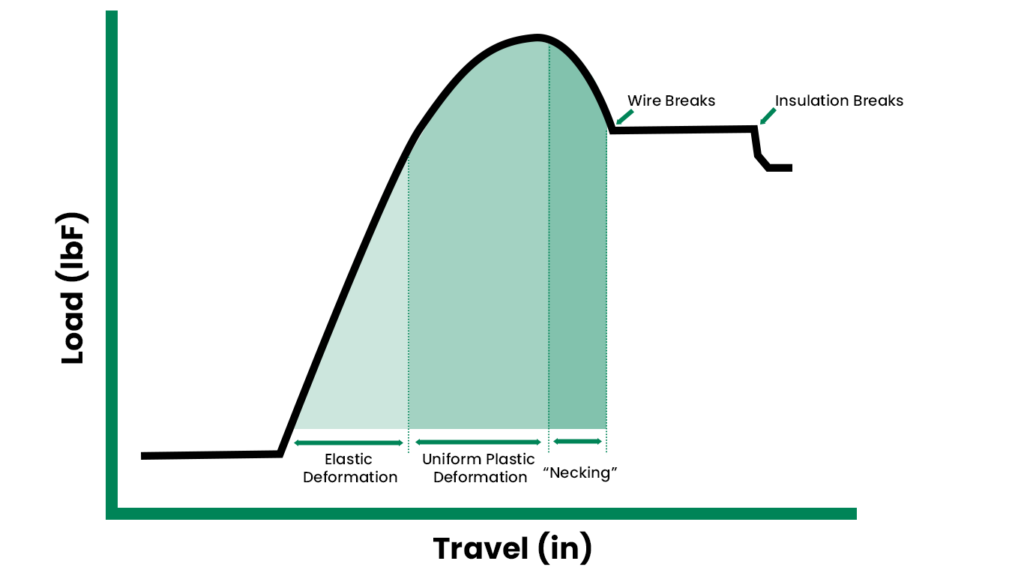
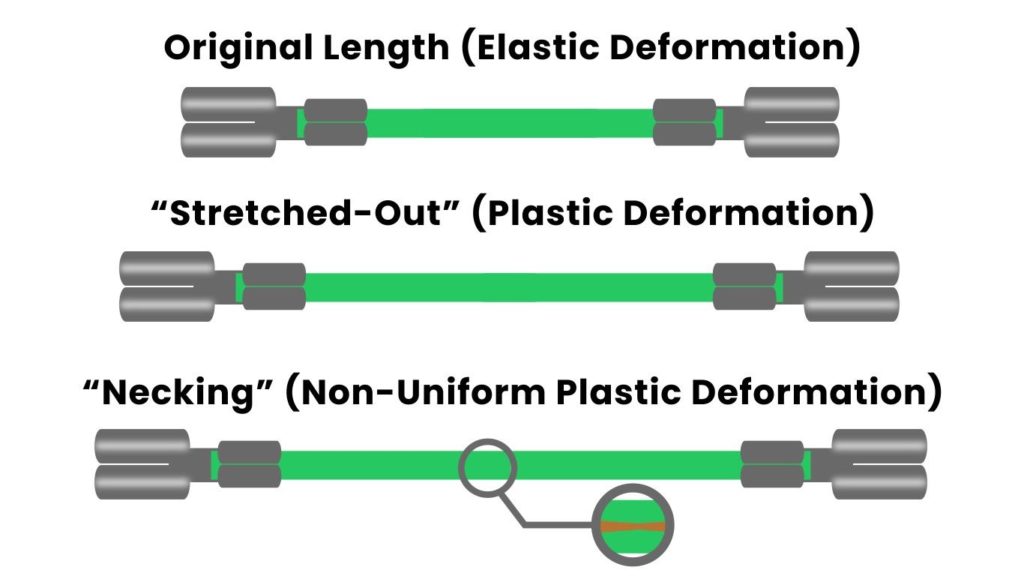
When any test article, cable or otherwise, is subjected to a pull force, its reaction to that force can be divided into two stages – Elastic Deformation and Plastic Deformation.
When a cable experiences elastic deformation, it absorbs the tensile energy, elongates, then returns to its normal shape once the force is no longer applied. If a cable experiences plastic deformation, its shape becomes permanently deformed and will not return to its original shape after the force is no longer applied. The point at which a test article goes from elastic deformation to plastic deformation is called yield, and that point of measurement is its Yield Strength. Plastic deformation can be further divided into Uniform and Non-Uniform Plastic Deformation. Non-uniform plastic deformation occurs when the deformation is unevenly distributed along the cable, commonly referred to as “necking.” After a period of non-uniform deformation, the test article ultimately breaks.
The measurement at the point of necking is known as the Ultimate Tensile Strength of the test article. This is the most commonly used measurement while tensile testing. With these concepts explained, let’s jump into an actual case study.
Reviewing Your Results
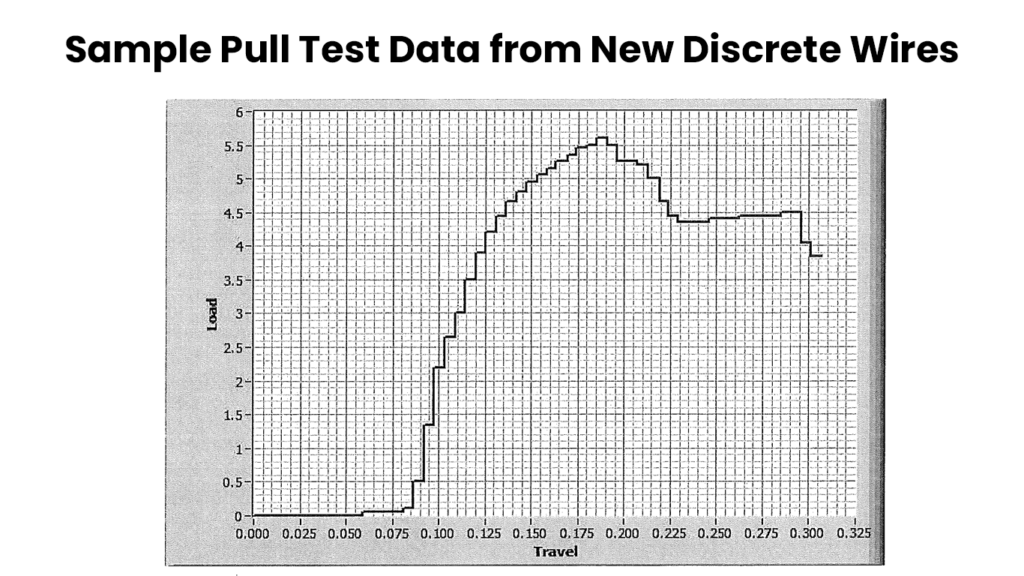
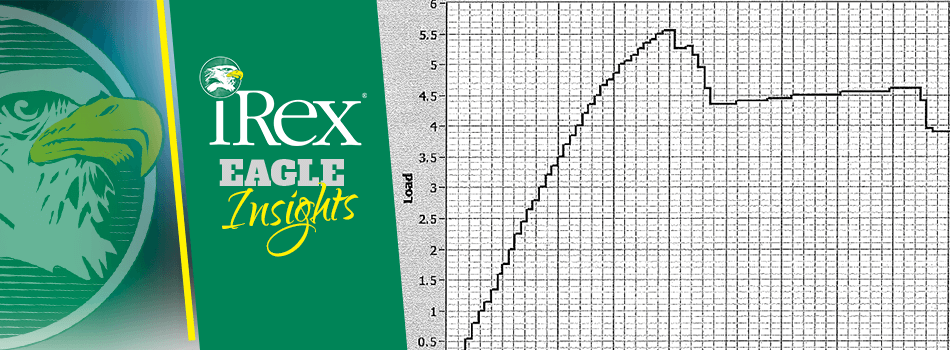
After iRex conducts a Pull and Break test, you will receive a chart and readout from the test similar to the one shown in the graphic above. Here, the x-axis shows the travel, or how long the cable stretches, measured by inches in this example. The y-axis shows the load, or the amount of force applied, measured here in pound-force (lbF)
As you can see, the cable first responded to the force in a nearly linear fashion during elastic deformation. The point where the curve began to flatten is where it started to experience plastic deformation, culminating in the peak of the graph around 5.6lbF and approximately .175 inches of travel. After that, the graph dips dramatically as the wire necks and fractures.
What’s interesting about this graph is how it continues to travel from approximately .225 to almost .3 inches at a near consistent load. This is likely due to the more elastic insulation continuing to stretch after the wire inside has already broken.
In addition to the graph, you’ll receive a list of statistics like these:
- Maximum: 5.6
- Minimum: -.2
- Average: 3.8335
- Area Under Curve: 1.8784
- Standard Deviation: 1.4234
- Variance: 2.0261
For our purposes, the maximum is really the only statistic we need. As described earlier, 5.6lbF is the cable’s Ultimate Tensile Strength at the top of the graph where the cable presumably went from experiencing uniform plastic deformation to non-uniform plastic deformation.
It’s interesting to note what the Area Under the Curve statistic actually represents here. This statistic can also be referred to as Strain Energy as it’s the total amount of mechanical energy per unit of volume that’s been absorbed by the test article up to that value of strain, or in our case, “load.”
How to Use the Results
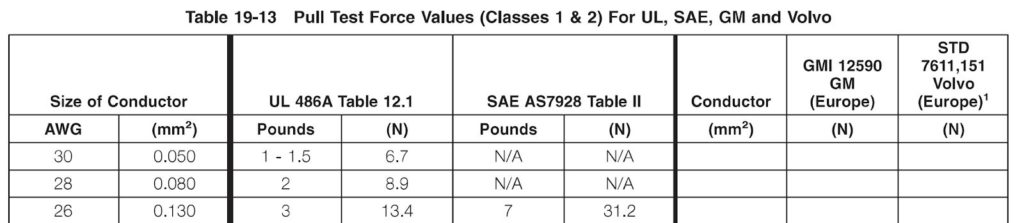
Now that we know how to read our results and how our cable behaves under strain, it’s time to compare our results against a standard – iRex uses IPC A-620 standards. Once you’ve chosen a standard, you’ll need to know a few things:
- The use of the cable
- The make-up of the cable
- How the cable was crimped
- The gauge of the wire
Because the IPC is composed of industry experts from many different manufacturers, it’s not uncommon for said manufacturers or even entire industries to have their own specific set of standards within the general standard. What your cable is made of can also determine what class it’s in within a standard. For example, for the standard IEC 60228, a cable with a solid conductor would be Class 1 while one with a stranded conductor would be Class 2.
With this information, along with wire gauge and crimping method, all we do next is select the appropriate chart within the standard and compare the Maximum value we got – in this case 5.6lbF – with that standard to see if the crimp is up to spec.
Other Things to Consider
- Slippage. When analyzing pull test data, you sometimes encounter what we refer to as “chatter,” or jumps in the readout. This can be caused by slippage, where the cable has been partially pulled out of the clamps. Beyond observing it on the graph, iRex uses an extensometer to measure and counteract this.
- Test Frequency. Standards, along with process control contracts, often dictate just how often crimps should be tested.
- Expected tensile strength. Standards dictate how much of a cable’s tensile strength should be generated from the crimp itself. For example, IPC A-620 states that a crimp should account for no less than 60% of a wire’s tensile strength, unless otherwise stated.
In summary, this article and series underscores just how much we pride ourselves on quality. To request a quote for your testing needs, contact us today.